Multiple Choice
Solve the problem.
-Here are 3 boxplots of weekly gas prices at a service station in the United States (price in $ per gallon) . Compare the distribution of prices over the three years. 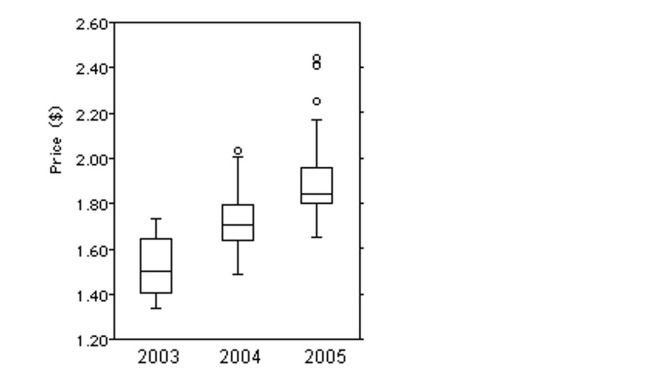
A) Gas prices have been increasing on average over the 3-year period, but the variation in the middle 50% has decreased while variation for the entire distribution has increased. The Distribution has been left-skewed, and there were 3 potential outliers in 2005.
B) Gas prices have been decreasing on average over the 3-year period, and the variation has been decreasing overall. The distribution has been left-skewed, and there were 3 potential Outliers in 2005.
C) Gas prices have been decreasing on average over the 3-year period, but the variation in the middle 50% has been increasing while variation for the entire distribution has decreased. The Distribution has been right-skewed, and there were 3 potential outliers in 2005.
D) Gas prices have been increasing on average over the 3-year period, and the variation overall has been increasing as well. The distribution has been right-skewed, and there were 3 Potential outliers in 2005.
Correct Answer:

Verified
Correct Answer:
Verified
Q1: A teacher records the test scores for
Q2: Find the median for the given
Q4: Determine the quartile or interquartile range as
Q5: Find the range for the given
Q6: <span class="ql-formula" data-value="\text { Explain what each
Q7: A teacher records the test scores for
Q8: Identify potential outliers, if any, for
Q9: Determine the quartile or interquartile range
Q10: Use the empirical rule to solve the
Q11: Construct and interpret a boxplot or