Essay
Provide an appropriate response.
-The bar graph below shows the number of car accidents occurring in one city in each of the years 2001 through 2006. The vertical axis is truncated and as a result the graph is misleading. Construct an improved version of the graph which is less misleading. Use the symbol // in your graph. Explain what the symbol // means. 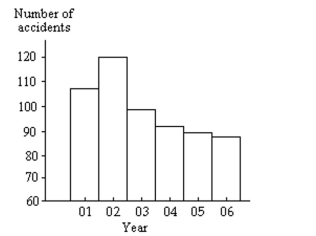
Correct Answer:

Verified
Answers will vary. Check students' graph...View Answer
Unlock this answer now
Get Access to more Verified Answers free of charge
Correct Answer:
Verified
View Answer
Unlock this answer now
Get Access to more Verified Answers free of charge
Q82: Construct a pie chart representing the
Q83: Identify the variable.<br>-The following table gives
Q84: A graphical display of a data set
Q85: A graphical display of a data
Q86: When organizing data into tables, what is
Q88: Provide an appropriate response.<br>-Explain in your own
Q89: Construct a stem-and-leaf diagram for the
Q90: A discrete variable can only yield whole-number
Q91: Complete the contingency table and use
Q92: The following table gives the top