Multiple Choice
A graphical display of a data set is given. Identify the overall shape of the distribution as (roughly) bell-shaped,triangular, uniform, reverse J-shaped, J-shaped, right skewed, left skewed, bimodal, or multimodal.
-A relative frequency histogram for the sale prices of homes sold in one city during 2006 is shown below. 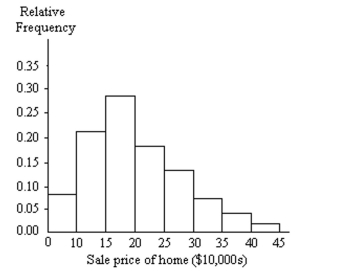
A) Reverse J-shaped
B) J-shaped
C) Left skewed
D) Right skewed
Correct Answer:

Verified
Correct Answer:
Verified
Q79: Construct the requested histogram.<br>-The table gives
Q80: Scott Tarnowski owns a pet grooming
Q81: Construct a stem-and-leaf diagram for the
Q82: Construct a pie chart representing the
Q83: Identify the variable.<br>-The following table gives
Q85: A graphical display of a data
Q86: When organizing data into tables, what is
Q87: Provide an appropriate response.<br>-The bar graph below
Q88: Provide an appropriate response.<br>-Explain in your own
Q89: Construct a stem-and-leaf diagram for the