Multiple Choice
Complete the contingency table and use it to solve the problem.
-The partially filled contingency table gives the frequencies of the data on age (in years) and sex from the residents of a retirement home. 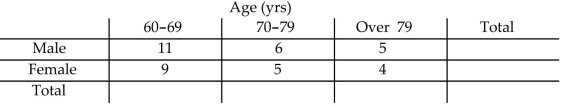
What is the relative frequency for persons in the age group 60-69?
A)
B)
C)
D)
Correct Answer:

Verified
Correct Answer:
Verified
Q40: Construct a dotplot for the given
Q41: A random sample of federal income
Q42: A nurse measured the blood pressure of
Q43: Construct the requested histogram.<br>-The table below
Q44: Classify the data as either discrete or
Q46: A graphical display of a data set
Q47: The temperature in Manhattan at 1 p.m.
Q48: Provide an appropriate response.<br>-The preschool children
Q49: A graphical display of a data set
Q50: Maria constructed the frequency distribution shown