Multiple Choice
A graphical display of a data set is given. State whether the distribution is (roughly) symmetric, right skewed, or leftskewed.
-A relative frequency histogram for the sale prices of homes sold in one city during 2006 is shown below. 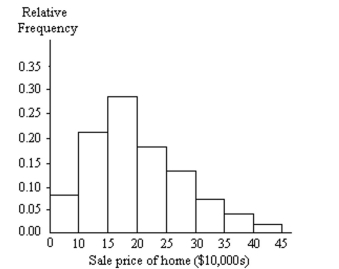
A) Left skewed
B) Symmetric
C) Right skewed
Correct Answer:

Verified
Correct Answer:
Verified
Q41: A random sample of federal income
Q42: A nurse measured the blood pressure of
Q43: Construct the requested histogram.<br>-The table below
Q44: Classify the data as either discrete or
Q45: Complete the contingency table and use
Q47: The temperature in Manhattan at 1 p.m.
Q48: Provide an appropriate response.<br>-The preschool children
Q49: A graphical display of a data set
Q50: Maria constructed the frequency distribution shown
Q51: A graphical display of a data set