Multiple Choice
Construct a pie chart representing the given data set.
-The data below represent the results of a poll in which the the following question was asked: "To what degree are you satisfied with the outcome of the 2006 mayoral election?
Very
Somewhat
Not at All
No opinion 
A) 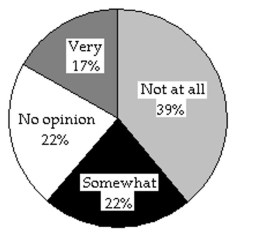
B) 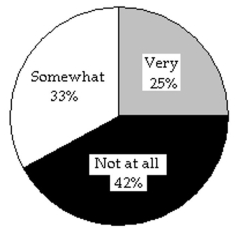
Correct Answer:

Verified
Correct Answer:
Verified
Q15: The results of a survey about
Q16: The following table shows the heights
Q17: Construct a relative-frequency polygon for the
Q18: Provide an appropriate response.<br>-A parcel delivery service
Q19: Complete the contingency table and use
Q21: A nurse measured the blood pressure of
Q22: Complete the contingency table and use
Q23: Use single-value grouping to organize these
Q25: A graphical display of a data set
Q49: Determine which of the four levels of