Essay
Provide an appropriate response.
-A parcel delivery service lowered its prices and finds that it has delivered twice as many parcels this year as it did last year. To illustrate this fact, the manager draws a pictogram as shown below. Each cube depicts a parcel. The side length of the "parcel" on the right is twice the side length of the "parcel" on the left. 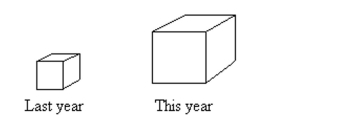 Why is this pictogram misleading? What visual impression is portrayed by the pictogram?
Correct Answer:

Verified
Answers will vary. Possible answer: The...View Answer
Unlock this answer now
Get Access to more Verified Answers free of charge
Correct Answer:
Verified
View Answer
Unlock this answer now
Get Access to more Verified Answers free of charge
Q13: Construct a pie chart representing the
Q14: A graphical display of a data
Q15: The results of a survey about
Q16: The following table shows the heights
Q17: Construct a relative-frequency polygon for the
Q19: Complete the contingency table and use
Q20: Construct a pie chart representing the
Q21: A nurse measured the blood pressure of
Q22: Complete the contingency table and use
Q23: Use single-value grouping to organize these