Multiple Choice
A graphical display of a data set is given. Identify the overall shape of the distribution as (roughly) bell-shaped,triangular, uniform, reverse J-shaped, J-shaped, right skewed, left skewed, bimodal, or multimodal.
-Two dice were rolled and the sum of the two numbers was recorded. This procedure was repeated 400 times. The results are shown in the relative frequency histogram below. 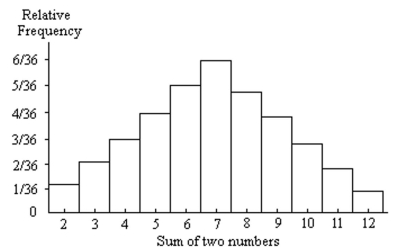
A) Right-skewed
B) Triangular
C) Left skewed
D) Bell-shaped
Correct Answer:

Verified
Correct Answer:
Verified
Q46: A graphical display of a data set
Q47: The temperature in Manhattan at 1 p.m.
Q48: Provide an appropriate response.<br>-The preschool children
Q49: A graphical display of a data set
Q50: Maria constructed the frequency distribution shown
Q52: The possible values of a discrete variable
Q54: A graphical display of a data set
Q55: Classify the data as either discrete
Q56: Construct a stem-and-leaf diagram for the
Q119: Explain in your own words the difference