Multiple Choice
Complete the contingency table and use it to solve the problem.
-The partially filled contingency table gives the relative frequencies of the data on age (in years) and sex from the residents of a retirement home. 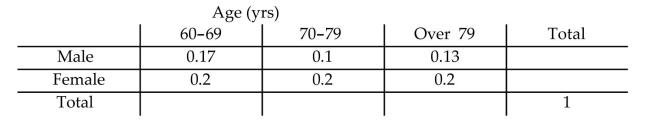 What percentage of residents are females in the age group 70-79?
A) 20%
B) 22%
C) 19.5%
D) 18%
Correct Answer:

Verified
Correct Answer:
Verified
Q4: Construct a bar graph for the
Q5: Use single-value grouping to organize these
Q6: The number of cars passing a busy
Q7: Provide an appropriate response.<br>-Suppose that a group
Q8: The following table gives the top
Q10: A television manufacturer sold three times as
Q11: What type of data is provided by
Q12: Construct the requested histogram.<br>-During the quality
Q13: Construct a pie chart representing the
Q14: A graphical display of a data