Multiple Choice
Construct a pie chart representing the given data set.
-The following data give the distribution of the types of houses in a town containing 26,000 houses. 
A) 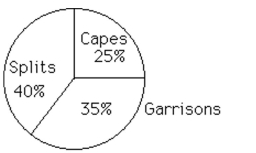
B) 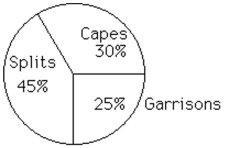
Correct Answer:

Verified
Correct Answer:
Verified
Related Questions
Q8: The following table gives the top
Q9: Complete the contingency table and use it
Q10: A television manufacturer sold three times as
Q11: What type of data is provided by
Q12: Construct the requested histogram.<br>-During the quality
Q14: A graphical display of a data
Q15: The results of a survey about
Q16: The following table shows the heights
Q17: Construct a relative-frequency polygon for the
Q18: Provide an appropriate response.<br>-A parcel delivery service