Essay
The table below shows a distribution and the observed frequencies of the values of a variable from a simple random sample of a population. Perform a chi-square goodness-of-fit test, at the specified significance level, to decide whether the distribution of the variable differs from the given distribution. 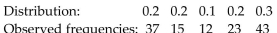
Observed frequencies: 3 Significance level
Correct Answer:

Verified
Correct Answer:
Verified
Q1: Use the contingency table to solve the
Q3: <span class="ql-formula" data-value="x ^ { 2 }"><span
Q4: When performing a chi-square goodness-of-fit test, why
Q5: Perform a chi-square independence test using the
Q6: Perform a chi-square independence test using the
Q7: Perform a chi-square homogeneity test, provided
Q8: The table below shows a distribution
Q9: Use the contingency table to solve the
Q10: Perform the indicated goodness-of-fit test. Be
Q11: Perform the indicated goodness-of-fit test. Be