Multiple Choice
Use the contingency table to solve the problem.
-The following contingency table shows the popular votes cast in the 1984 presidential election cross classified by region and political party. Data are in thousands, rounded to the nearest thousand. 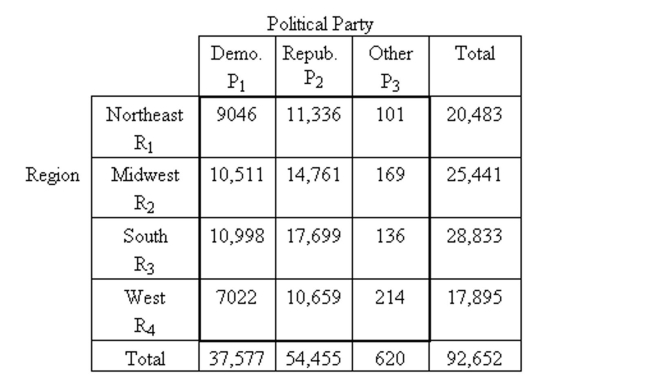 What percentage of the people voted Democrat and were in the West?
A) 40.6%
B) 39.2%
C) 18.7%
D) 7.6%
Correct Answer:

Verified
Correct Answer:
Verified
Q2: The table below shows a distribution
Q3: <span class="ql-formula" data-value="x ^ { 2 }"><span
Q4: When performing a chi-square goodness-of-fit test, why
Q5: Perform a chi-square independence test using the
Q6: Perform a chi-square independence test using the
Q7: Perform a chi-square homogeneity test, provided
Q8: The table below shows a distribution
Q9: Use the contingency table to solve the
Q10: Perform the indicated goodness-of-fit test. Be
Q11: Perform the indicated goodness-of-fit test. Be