Multiple Choice
SCENARIO 19-3 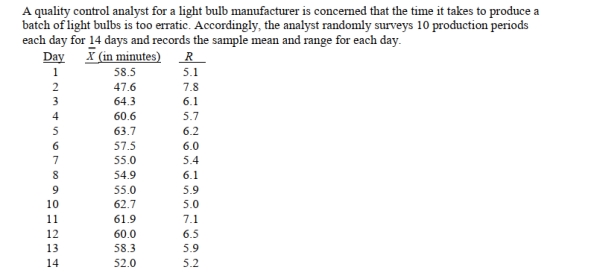
-Referring to Scenario 19-3, suppose the analyst constructs an R chart to see if the variability in
Production times is in-control.What is the upper control limit for this R chart?
A) 10.66
B) 9.37
C) 7.98
D) 6.34
Correct Answer:

Verified
Correct Answer:
Verified
Q34: True or False: Quick Changeover Techniques establish
Q35: True or False: The focus of Lean
Q36: True or False: Quick Changeover Techniques establish
Q37: True or False: SS method is among
Q38: True or False: The CPL and CPU
Q40: SCENARIO 19-3 <img src="https://d2lvgg3v3hfg70.cloudfront.net/TB2675/.jpg" alt="SCENARIO 19-3
Q41: SCENARIO 19-4 <img src="https://d2lvgg3v3hfg70.cloudfront.net/TB2675/.jpg" alt="SCENARIO 19-4
Q42: True or False: SMED establishes ways to
Q43: SCENARIO 19-3 <img src="https://d2lvgg3v3hfg70.cloudfront.net/TB2675/.jpg" alt="SCENARIO 19-3
Q44: True or False: The smaller the capability