Multiple Choice
SCENARIO 19-4 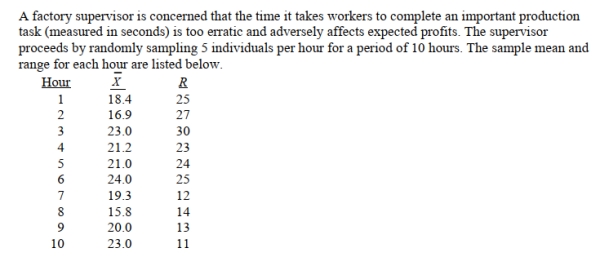 She also decides that lower and upper specification limit for the critical-to-quality variable should be
10 and 30 seconds, respectively.
-Referring to Scenario 19-4, suppose the supervisor constructs an R chart to see if the variability in
Collection times is in-control.What are the lower and upper control limits for this R chart?
A) - 2.33, 43.13
B) - 2.28, 42.28
C) 0, 42.28
D) 0, 43.13
Correct Answer:

Verified
Correct Answer:
Verified
Q36: True or False: Quick Changeover Techniques establish
Q37: True or False: SS method is among
Q38: True or False: The CPL and CPU
Q39: SCENARIO 19-3 <img src="https://d2lvgg3v3hfg70.cloudfront.net/TB2675/.jpg" alt="SCENARIO 19-3
Q40: SCENARIO 19-3 <img src="https://d2lvgg3v3hfg70.cloudfront.net/TB2675/.jpg" alt="SCENARIO 19-3
Q42: True or False: SMED establishes ways to
Q43: SCENARIO 19-3 <img src="https://d2lvgg3v3hfg70.cloudfront.net/TB2675/.jpg" alt="SCENARIO 19-3
Q44: True or False: The smaller the capability
Q45: <img src="https://d2lvgg3v3hfg70.cloudfront.net/TB2675/.jpg" alt=" " class="answers-bank-image d-block" rel="preload"
Q46: True or False: The R chart is