Multiple Choice
SCENARIO 19-3 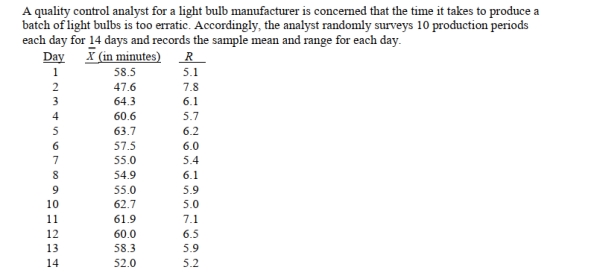
-Referring to Scenario 19-3, suppose the sample mean and range data were based on 11
Observations per day instead of 10.How would this change affect the lower and upper control
Limits of the R chart?
A) LCL would increase; UCL would decrease.
B) LCL would remain the same; UCL would decrease.
C) Both LCL and UCL would remain the same.
D) LCL would decrease; UCL would increase.
Correct Answer:

Verified
Correct Answer:
Verified
Q8: SCENARIO 19-1<br>A local newspaper has 10 delivery
Q36: The cause of variation that can be
Q60: SCENARIO 19-3 <img src="https://d2lvgg3v3hfg70.cloudfront.net/TB2675/.jpg" alt="SCENARIO 19-3
Q62: True or False: The SS method involves
Q63: SCENARIO 19-4 <img src="https://d2lvgg3v3hfg70.cloudfront.net/TB2675/.jpg" alt="SCENARIO 19-4
Q64: True or False: SMED focuses on preventing
Q66: SCENARIO 19-4 <img src="https://d2lvgg3v3hfg70.cloudfront.net/TB2675/.jpg" alt="SCENARIO 19-4
Q67: True or False: Changes in the system
Q69: True or False: Poke-Yoke devices establish ways
Q70: SCENARIO 19-4 <img src="https://d2lvgg3v3hfg70.cloudfront.net/TB2675/.jpg" alt="SCENARIO 19-4