Multiple Choice
SCENARIO 19-4 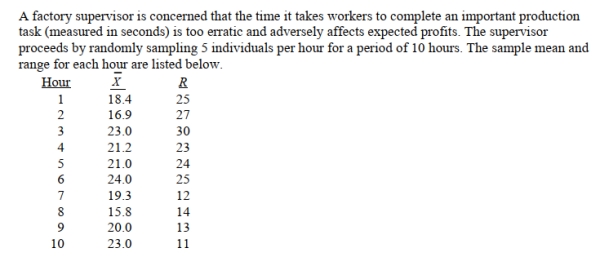 She also decides that lower and upper specification limit for the critical-to-quality variable should be
10 and 30 seconds, respectively.
-Referring to Scenario 19-4, suppose the supervisor constructs an R chart to see if the variability in
Collection times is in-control.What is the center line of this R chart?
A) 20.00
B) 20.56
C) 20.40
D) 24.00
Correct Answer:

Verified
Correct Answer:
Verified
Q8: SCENARIO 19-1<br>A local newspaper has 10 delivery
Q36: The cause of variation that can be
Q59: SCENARIO 19-3 <img src="https://d2lvgg3v3hfg70.cloudfront.net/TB2675/.jpg" alt="SCENARIO 19-3
Q60: SCENARIO 19-3 <img src="https://d2lvgg3v3hfg70.cloudfront.net/TB2675/.jpg" alt="SCENARIO 19-3
Q62: True or False: The SS method involves
Q64: True or False: SMED focuses on preventing
Q65: SCENARIO 19-3 <img src="https://d2lvgg3v3hfg70.cloudfront.net/TB2675/.jpg" alt="SCENARIO 19-3
Q66: SCENARIO 19-4 <img src="https://d2lvgg3v3hfg70.cloudfront.net/TB2675/.jpg" alt="SCENARIO 19-4
Q67: True or False: Changes in the system
Q94: SCENARIO 19-2<br>A political pollster randomly selects a