Multiple Choice
Solve the problem.
-The following scatter diagram shows heights (in inches) of children and their ages. 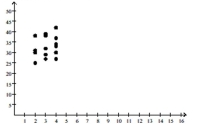
Age (years) What is the expected height range for a 2-year old child?
A) 40-50 inches
B) 35-45 inches
C) 25-38 inches
D) 20-30 inches
Correct Answer:

Verified
Correct Answer:
Verified
Related Questions
Q27: Graph the function using its vertex,
Q28: Use factoring to find the zeros
Q29: Graph the function f by starting
Q30: Find the real zeros of the
Q31: Find the real zeros of the
Q34: Solve the inequality. Express your answer
Q35: Find the zeros of the quadratic
Q36: Find the zeros of the quadratic
Q37: Find the real zeros, if any,
Q145: Find the zero of the linear function.<br>-h(x)