Multiple Choice
The following graph shows the populations of the metropolitan areas of City X and City Y over six years. 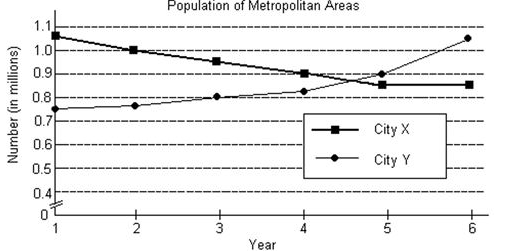
-In what years was the population of the City X metropolitan area less than that of the City Y metropolitan area?
A) Years 1-5
B) Years 3-5
C) Years 5-6
D) Years 1-3
Correct Answer:

Verified
Correct Answer:
Verified
Related Questions
Q28: Solve the problem.<br>-The sum of a studentʹs
Q29: Which method should be used to
Q30: Graph the solution set of the system
Q31: Find the value of the determinant.<br>-
Q32: Use the Gauss-Jordan method to solve
Q34: Use the Gauss-Jordan method to solve
Q35: Provide an appropriate response.<br>-Suppose that
Q36: Solve the system by using the
Q37: Decide whether or not the matrices
Q38: Solve the system by elimination.<br>- <span