Multiple Choice
The following graph shows the populations of the metropolitan areas of City X and City Y over six years. 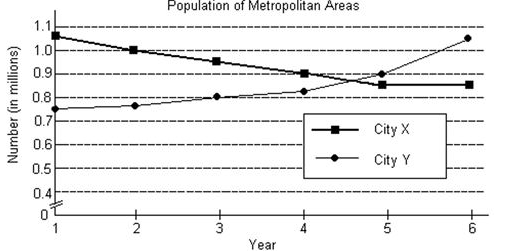
-If equations of the form y = f(t) were determined that modeled either of the two graphs, then the variable t would represent _______ and the variable y would represent _______.
A) population (in millions) ; year
B) City Y; City X
C) City X; City Y
D) year; population (in millions)
Correct Answer:

Verified
Correct Answer:
Verified
Q495: Solve the problem.<br>-A bakery sells three types
Q496: Find the inverse, if it exists,
Q497: Use a graphing calculator and the
Q498: Use a graphing calculator to solve
Q499: Solve the linear programming problem.<br>-A summer
Q500: The sizes of two matrices are
Q501: Use a graphing calculator to solve
Q502: Find the indicated matrix.<br>-Let <span
Q503: Solve the problem.<br>-A $64,000 trust is to
Q504: Use the Gauss-Jordan method to solve