Multiple Choice
Find the average rate of change illustrated in the graph.
-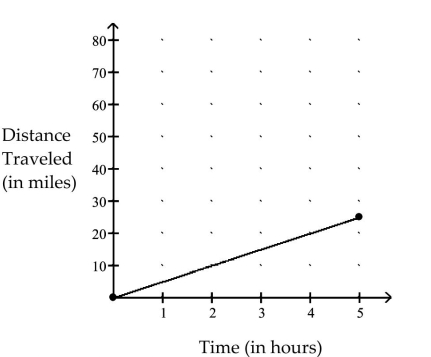
A) miles per hour
B) 5 miles per hour
C) miles per hour
D) 25 miles per hour
Correct Answer:

Verified
Correct Answer:
Verified
Related Questions
Q480: The graph of y = f(x)
Q481: Describe the transformations and give the
Q482: Graph the function.<br>- <span class="ql-formula" data-value="f
Q483: Solve the problem.<br>-A deep sea diving bell
Q484: Choose the value which could represent
Q486: Find the requested function value.<br>-Find
Q487: Solve the problem.<br>-The graph shows an
Q488: Find the requested function value.<br>-Find
Q489: Solve the problem.<br>-The table lists how
Q490: Give the domain and range of