Multiple Choice
Find the average rate of change illustrated in the graph.
-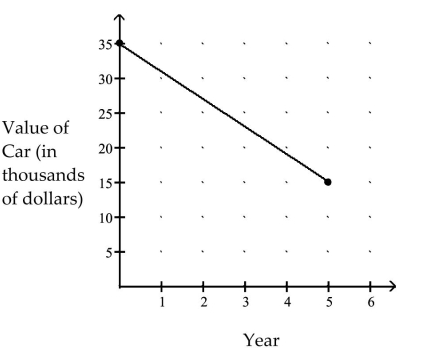
A) per year
B) per year
C) per year
D) per year
Correct Answer:

Verified
Correct Answer:
Verified
Related Questions
Q511: Give the domain and range of
Q512: Solve the problem.<br>-Find the center-radius form
Q513: Graph the equation by plotting points.<br>-
Q514: Decide whether the relation defines a function.<br>-{(-5,
Q515: A new chocolate company is estimating how
Q517: Suppose the point (2, 4) is on
Q518: Determine if the function is even,
Q519: Solve the problem.<br>-The cost of manufacturing
Q520: Graph the line and give the
Q521: Determine whether (f ∘ g)(x) =