Multiple Choice
A new chocolate company is estimating how many candy bars per week college students will consume of their line of
products. The graph shows the probable number of candy bars students (age 18 -22) will consume from year 0 to year 10.
B(x) gives the number of candy bars for boys, G(x) gives the number of candy bars for girls, and T(x) gives the total
number for both groups. Use the graph to answer the question. 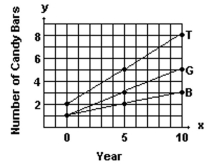
-Use the slopes of the line segments to decide in which period (0-5 or 5-10) the number of candy bars per week increased more rapidly.
A) 0-5
B) 5-10
C) The number of candy bars increased at the same rate in both periods
Correct Answer:

Verified
Correct Answer:
Verified
Q510: Solve the problem.<br>-Use the graphs to
Q511: Give the domain and range of
Q512: Solve the problem.<br>-Find the center-radius form
Q513: Graph the equation by plotting points.<br>-
Q514: Decide whether the relation defines a function.<br>-{(-5,
Q516: Find the average rate of change
Q517: Suppose the point (2, 4) is on
Q518: Determine if the function is even,
Q519: Solve the problem.<br>-The cost of manufacturing
Q520: Graph the line and give the