Multiple Choice
The bar graph shows the number of tickets sold each week by the garden club for their annual flower show. Use the
graph to answer the question.
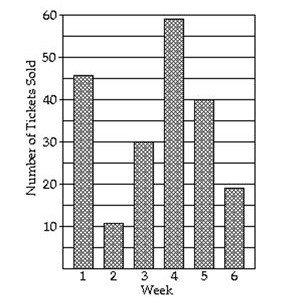
-During which weeks were the number of tickets sold more than 25?
A) weeks 1, 4, and 5
B) weeks 1, 3, and 4
C) weeks 1, 3, and 5
D) weeks 1, 3, 4, and 5
Correct Answer:

Verified
Correct Answer:
Verified
Related Questions
Q10: Determine whether the relation is also
Q11: Write the word or phrase that
Q12: The line graph shows the recorded hourly
Q13: Find an equation of the line
Q14: Solve.<br>-A study of grocery buying habits
Q16: Decide whether the equation describes a
Q17: Complete the table of ordered pairs
Q18: Solve. Assume the exercise describes a
Q19: Use the slope-intercept form to graph
Q20: Fill in the blank with one