Multiple Choice
The line graph shows the recorded hourly temperatures in degrees Fahrenheit at an airport. Use the graph to answer the
question. 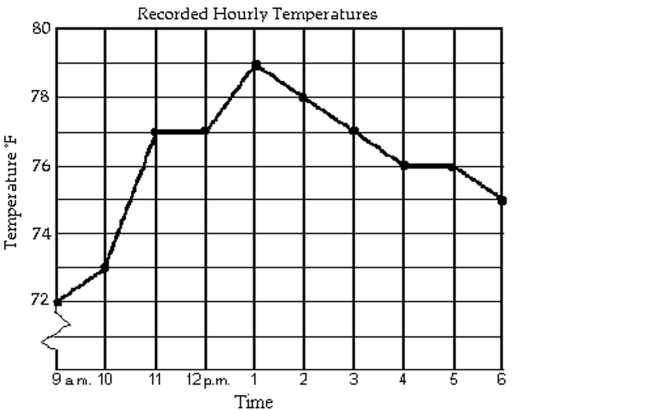
-During which hour did the temperature increase the most?
A) 9 a.m. to 10 a.m.
B) 10 a.m. to 11 a.m.
C) 12 p.m. to 1 p.m.
D) 1 p.m. to 2 p.m.
Correct Answer:

Verified
Correct Answer:
Verified
Related Questions
Q7: Graph the linear equation by finding
Q8: Find the slope of the line
Q9: Find the domain of the function.<br>-
Q10: Determine whether the relation is also
Q11: Write the word or phrase that
Q13: Find an equation of the line
Q14: Solve.<br>-A study of grocery buying habits
Q15: The bar graph shows the number
Q16: Decide whether the equation describes a
Q17: Complete the table of ordered pairs