Multiple Choice
The line graph shows the recorded hourly temperatures in degrees Fahrenheit at an airport. Use the graph to answer the
question. 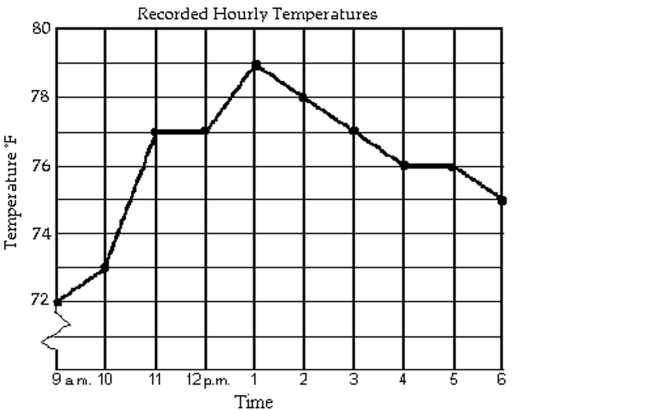
-At what time was the temperature the lowest?
A) 9 a.m.
B) 6 p.m.
C) 1 p.m.
D) 10 a.m.
Correct Answer:

Verified
Correct Answer:
Verified
Related Questions
Q39: Fill in the blank with one
Q40: Determine whether the ordered pair is
Q41: Identify the intercepts.<br>-<img src="https://d2lvgg3v3hfg70.cloudfront.net/TB4850/.jpg" alt=" Identify
Q42: Determine whether the relation is also
Q43: Solve. Assume the exercise describes a
Q45: A survey report project in Great
Q46: Plot the ordered pair. State in
Q47: Fill in the blank with one
Q48: Graph the linear equation.<br>- <span class="ql-formula"
Q49: Find an equation of the line