Multiple Choice
A survey report project in Great Britain estimated that for the years 2000-2005, the total number of bakeries in a particular region would grow according to the linear equation , where is the number of years after 2000. Graph the equation and use the graph to predict the total number bakeries in 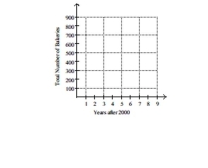
A) 582 bakeries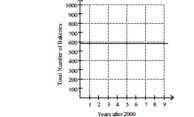
B) 600 bakeries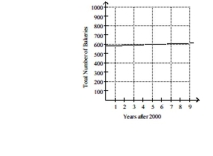
C) 560 bakeries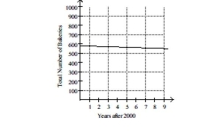
D) 500 bakeries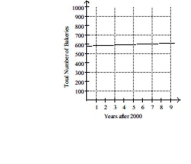
Correct Answer:

Verified
Correct Answer:
Verified
Q40: Determine whether the ordered pair is
Q41: Identify the intercepts.<br>-<img src="https://d2lvgg3v3hfg70.cloudfront.net/TB4850/.jpg" alt=" Identify
Q42: Determine whether the relation is also
Q43: Solve. Assume the exercise describes a
Q44: The line graph shows the recorded hourly
Q46: Plot the ordered pair. State in
Q47: Fill in the blank with one
Q48: Graph the linear equation.<br>- <span class="ql-formula"
Q49: Find an equation of the line
Q50: Fill in the blank with one