Multiple Choice
The circle graph below shows the number of pizzas consumed by college students in a typical month. Use the graph to
answer the question. 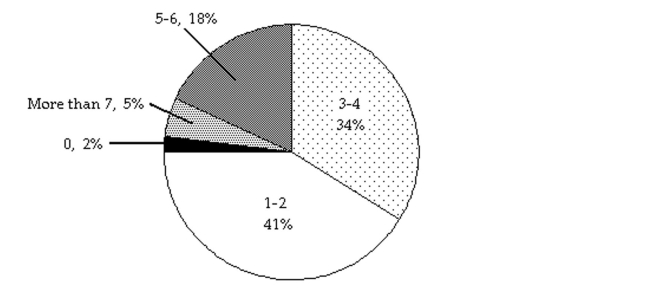
-What percent of college students consume 5-6 pizzas in a typical month?
A)
B)
C)
D)
Correct Answer:

Verified
Correct Answer:
Verified
Related Questions
Q14: Simplify the expression. First use the
Q15: Solve.<br>-A motorcycle traveling at 50 miles
Q16: Solve the inequality. Graph the solution
Q17: Solve. If needed, round money amounts to
Q18: Indicate whether the list of terms
Q20: Write the following as an algebraic expression.
Q21: Simplify the expression by combining any
Q22: Write the algebraic expression described.<br>-Given the
Q23: Write the algebraic expression described. Simplify
Q24: Solve the formula for the specified