Multiple Choice
The graph below shows the number of students enrolled in various courses at State University in spring 2000. Each bar
represents a different course, and the height of the bar represents the number of students enrolled. Use the graph to
answer the question. 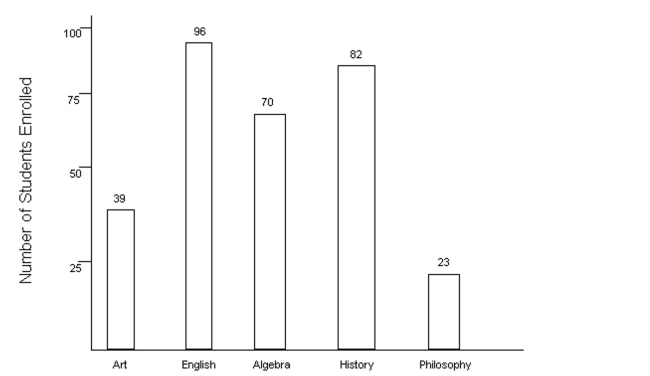
-Which course had the lowest enrollment?
A) Philosophy
B) Art
C) Algebra
D) English
Correct Answer:

Verified
Correct Answer:
Verified
Q2: Simplify the expression.<br>- <span class="ql-formula" data-value="\frac
Q3: Simplify the expression.<br>- <span class="ql-formula" data-value="|
Q4: Fill in the blank with one
Q5: Write the sentence as an equation
Q6: Multiply or divide as indicated. Write
Q7: Solve.<br>-At the end of last year, Widgets
Q8: Insert <span class="ql-formula" data-value="< ,
Q9: Solve the problem.<br>-As part of a fund
Q10: Fill in the blank with one
Q11: Find the additive inverse or opposite.<br>-10<br>A)