Multiple Choice
Which of the following could be an ogive?
A) 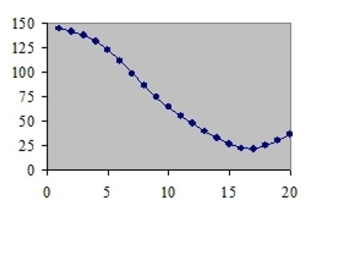
B) 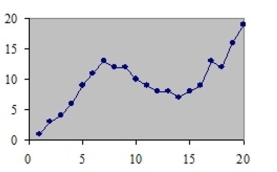
C) 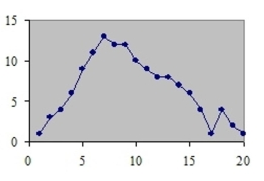
D) 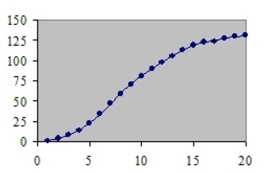
Correct Answer:

Verified
Correct Answer:
Verified
Related Questions
Q66: <span class="ql-formula" data-value="\text { How many values
Q67: A survey was taken on how
Q68: In an ungrouped frequency distribution of the
Q69: For the class 16.3-23.8, the width is
Q70: A time series graph represents data that
Q72: A Pareto chart arranges data from largest
Q73: A pie graph would best represent the
Q74: A stem and leaf plot has the
Q75: The following frequency distribution presents the
Q76: Construct a dotplot for the following