Multiple Choice
Construct a dotplot for the following data.
A) 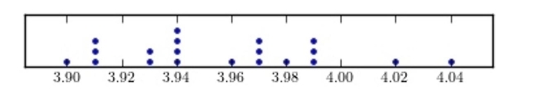
B) 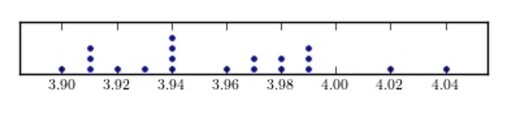
C) 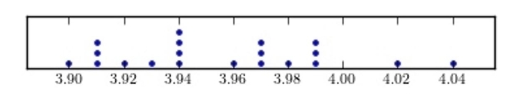
D) 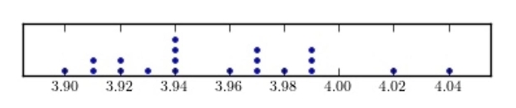
Correct Answer:

Verified
Correct Answer:
Verified
Related Questions
Q71: Which of the following could be an
Q72: A Pareto chart arranges data from largest
Q73: A pie graph would best represent the
Q74: A stem and leaf plot has the
Q75: The following frequency distribution presents the
Q77: What is the lower class limit in
Q78: A recent statistics exam yielded the
Q79: Karen is constructing a pie graph
Q80: <span class="ql-formula" data-value="\begin{array}{l}\text { Given the following
Q81: When data are collected in original form,