Multiple Choice
Using the ogive shown below, what is the cumulative frequency of data values less than o to 16 ?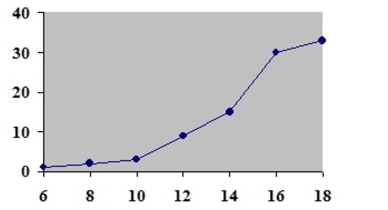
r equal
A) 20
B) 30
C) 66
D) 60
Correct Answer:

Verified
Correct Answer:
Verified
Related Questions
Q59: A time series graph is useful for
Q60: <img src="https://d2lvgg3v3hfg70.cloudfront.net/TB2571/.jpg" alt=" A) unimodal B)
Q61: <img src="https://d2lvgg3v3hfg70.cloudfront.net/TB2571/.jpg" alt=" A) 55-65 B)
Q62: Following are the numbers of Dean's
Q63: The frequency polygon is a graph that
Q65: <span class="ql-formula" data-value="\text { A Pareto chart
Q66: <span class="ql-formula" data-value="\text { How many values
Q67: A survey was taken on how
Q68: In an ungrouped frequency distribution of the
Q69: For the class 16.3-23.8, the width is