Multiple Choice
Following are the numbers of Dean's List students in a random sample of 20 university co Construct a dotplot for these data.
urses.
A) 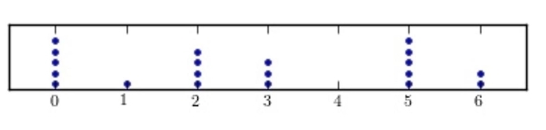
B) 
C) 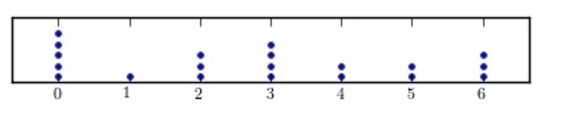
D) 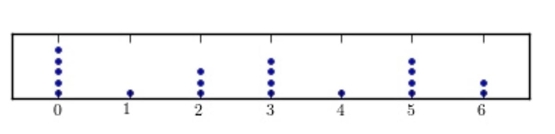
Correct Answer:

Verified
Correct Answer:
Verified
Q57: <span class="ql-formula" data-value="\text { What type of
Q58: <span class="ql-formula" data-value="\begin{array}{l}\text { Construct a pie
Q59: A time series graph is useful for
Q60: <img src="https://d2lvgg3v3hfg70.cloudfront.net/TB2571/.jpg" alt=" A) unimodal B)
Q61: <img src="https://d2lvgg3v3hfg70.cloudfront.net/TB2571/.jpg" alt=" A) 55-65 B)
Q63: The frequency polygon is a graph that
Q64: Using the ogive shown below, what is
Q65: <span class="ql-formula" data-value="\text { A Pareto chart
Q66: <span class="ql-formula" data-value="\text { How many values
Q67: A survey was taken on how