Multiple Choice
The following table presents the purchase totals (in dollars) of a random sample of gasoline purchases at a convenience store.
Construct a relative frequency histogram using a class width of 10, and using 0 as the lower class
Limit for the first class.
A) 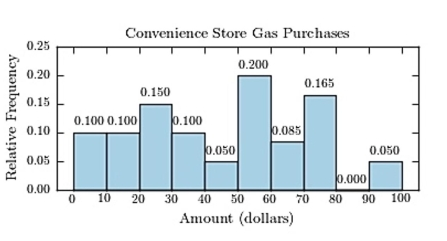
B) 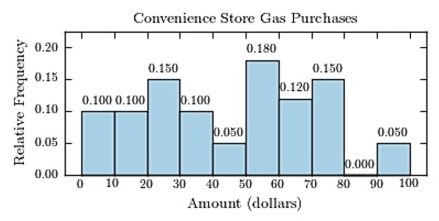
C) 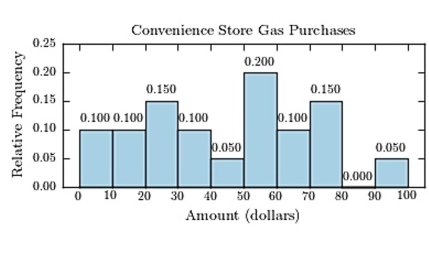 D)
D) 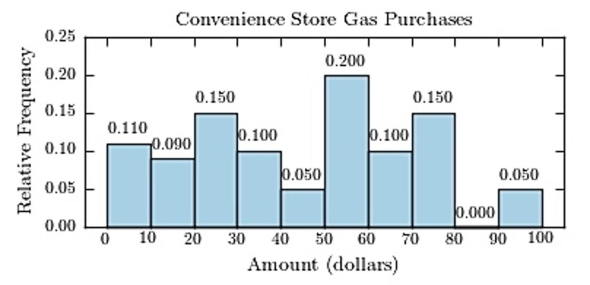
Correct Answer:

Verified
Correct Answer:
Verified
Q10: <span class="ql-formula" data-value="\begin{array}{l}\text { Construct a pie
Q11: The following frequency distribution presents the
Q12: The following frequency distribution presents the
Q13: A histogram is a graph that represents
Q14: For grouped frequency distributions, the is obtained
Q16: The lower class limit represents the smallest
Q17: Which of the following could be a
Q18: What are the boundaries of the class
Q19: Find the class boundaries, midpoint, and width
Q20: <span class="ql-formula" data-value="\begin{array}{l}\text { State the reason