Multiple Choice
The following frequency distribution presents the frequency of passenger vehicles that pa: through a certain intersection from 8:00 AM to 9:00 AM on a particular day.
Construct a relative frequency bar graph for the data.
A) 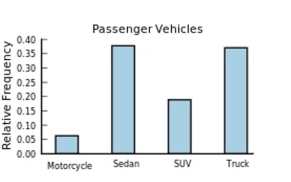
B) 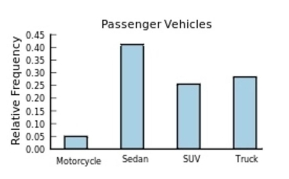
C) 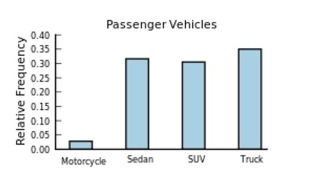
D) 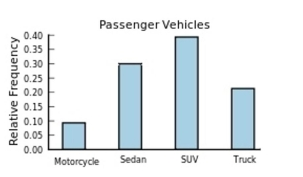
Correct Answer:

Verified
Correct Answer:
Verified
Q6: If the limits for a class were
Q7: Which of the following pairs of class
Q8: The following frequency distribution presents the
Q9: The following pie chart presents the percentages
Q10: <span class="ql-formula" data-value="\begin{array}{l}\text { Construct a pie
Q12: The following frequency distribution presents the
Q13: A histogram is a graph that represents
Q14: For grouped frequency distributions, the is obtained
Q15: The following table presents the purchase
Q16: The lower class limit represents the smallest