Multiple Choice
Thirty households were surveyed for the number of televisions in each home. Following a results.
Construct a frequency histogram.
A) 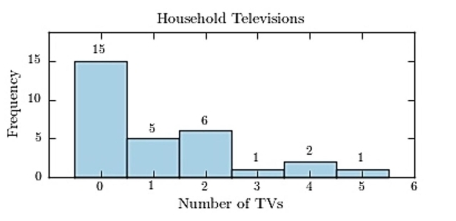
B) 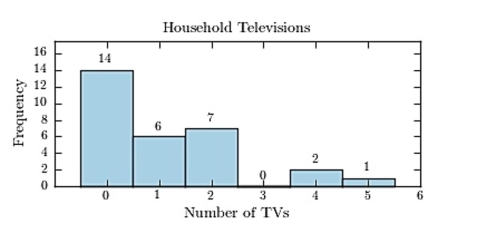
C) 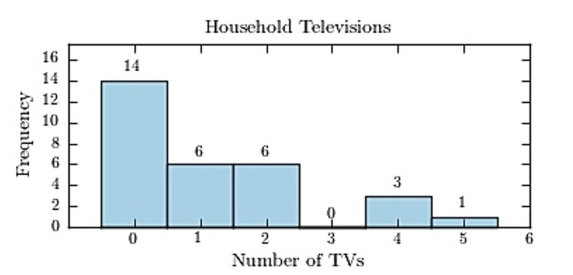
D) 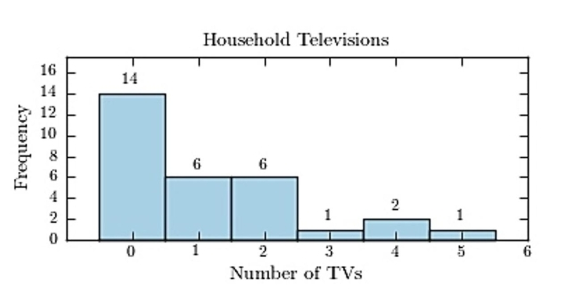
Correct Answer:

Verified
Correct Answer:
Verified
Related Questions
Q20: <span class="ql-formula" data-value="\begin{array}{l}\text { State the reason
Q21: Construct a stem-and-leaf plot for the
Q22: The following frequency distribution presents the
Q23: Which of the following is a histogram?<br>A)<br><img
Q24: When the range is large, and classes
Q26: What is the midpoint of the class
Q27: Greg wants to construct a frequency distribution
Q28: Which of the following does not need
Q29: <img src="https://d2lvgg3v3hfg70.cloudfront.net/TB2571/.jpg" alt=" A) 65-75 B)
Q30: Which graph should be used to represent