Multiple Choice
The following frequency distribution presents the frequency of passenger vehicles that pa through a certain intersection from 8:00 AM to 9:00 AM on a particular day.
Construct a pie chart for the data.
A) 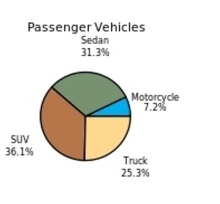
B) 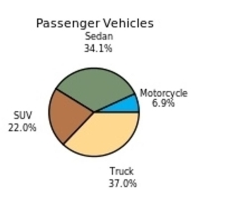
C) 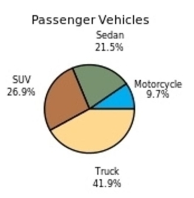
D) 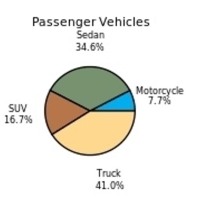
s
Correct Answer:

Verified
Correct Answer:
Verified
Related Questions
Q17: Which of the following could be a
Q18: What are the boundaries of the class
Q19: Find the class boundaries, midpoint, and width
Q20: <span class="ql-formula" data-value="\begin{array}{l}\text { State the reason
Q21: Construct a stem-and-leaf plot for the
Q23: Which of the following is a histogram?<br>A)<br><img
Q24: When the range is large, and classes
Q25: Thirty households were surveyed for the
Q26: What is the midpoint of the class
Q27: Greg wants to construct a frequency distribution