Multiple Choice
A sample of 200 high school students were asked how many hours per week they spend u television. The following frequency distribution presents the results.
Construct a relative frequency ogive for the frequency distribution. watching
A) 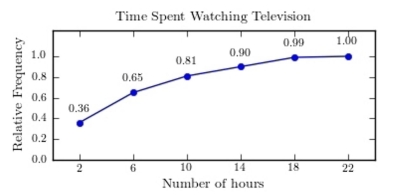
B) 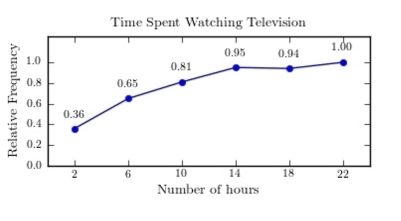
C) 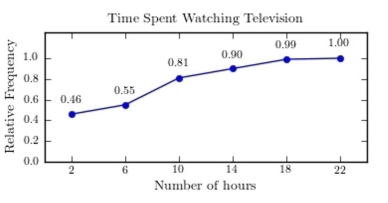
D) 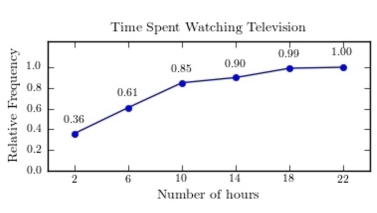
Correct Answer:

Verified
Correct Answer:
Verified
Q50: Construct a dotplot for the following
Q51: For the class 5-19, the upper class
Q52: A time series graph is useful for
Q53: The following frequency distribution presents the
Q54: The cumulative frequency for a class is
Q56: When two sets of data collected over
Q57: <span class="ql-formula" data-value="\text { What type of
Q58: <span class="ql-formula" data-value="\begin{array}{l}\text { Construct a pie
Q59: A time series graph is useful for
Q60: <img src="https://d2lvgg3v3hfg70.cloudfront.net/TB2571/.jpg" alt=" A) unimodal B)