Multiple Choice
Construct a dotplot for the following data.
A) 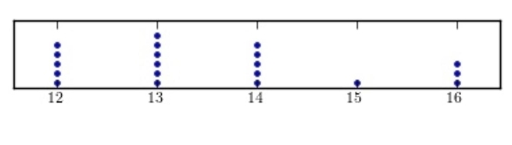
B) 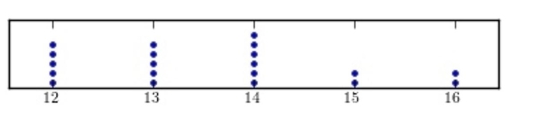
C) 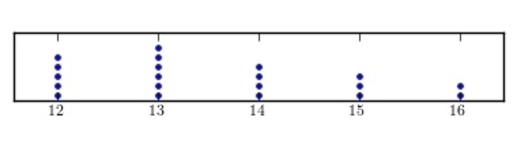
D) 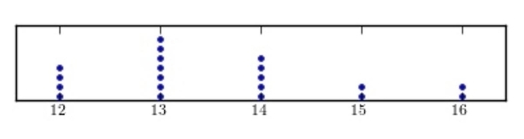
Correct Answer:

Verified
Correct Answer:
Verified
Related Questions
Q45: One hundred students are shown an eight-digit
Q46: What are the boundaries of the class
Q47: The following frequency distribution presents the
Q48: A weatherman records the amount of rain
Q49: For a given data set, the ogive
Q51: For the class 5-19, the upper class
Q52: A time series graph is useful for
Q53: The following frequency distribution presents the
Q54: The cumulative frequency for a class is
Q55: A sample of 200 high school