Multiple Choice
The following table presents the rate of population growth of a suburb of Atlanta, Georgic of the years 1990 through 2009 . Construct a time-series plot of the growth rate.
A) 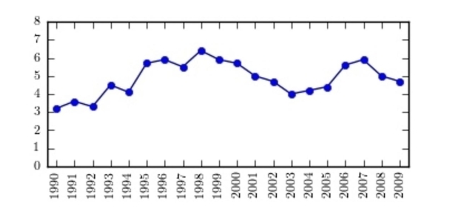
B) 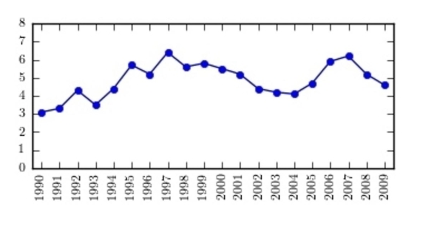
a for each
C) 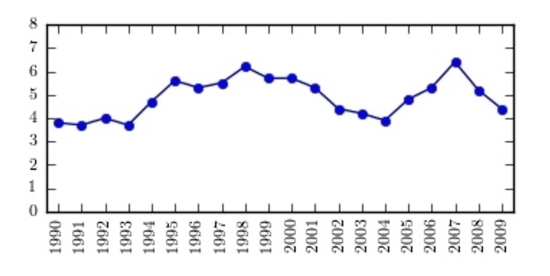
D) 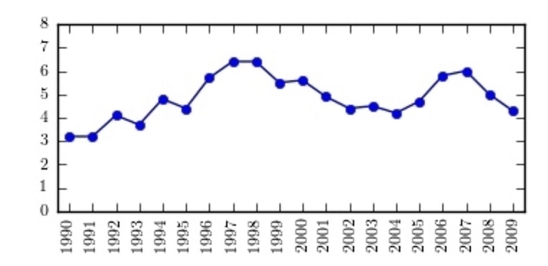
Correct Answer:

Verified
Correct Answer:
Verified
Related Questions
Q39: If a data set showing types
Q40: Graphs that show distributions using proportions instead
Q41: The following time-series plot presents the
Q42: The three most commonly used graphs in
Q43: Which of the following is a Pareto
Q45: One hundred students are shown an eight-digit
Q46: What are the boundaries of the class
Q47: The following frequency distribution presents the
Q48: A weatherman records the amount of rain
Q49: For a given data set, the ogive