Multiple Choice
The following time-series plot presents the population growth (in percent) of a suburb of Atlanta, Georgia for each of the years 1990 through 2009 . Estimate the rate of growth in 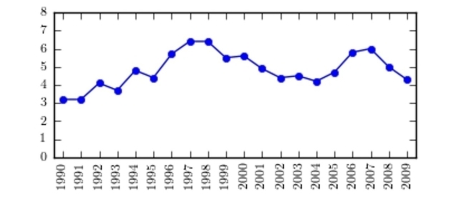
A) 6.6%
B) 6.0%
C) 4.9%
D) 7.0%
Correct Answer:

Verified
Correct Answer:
Verified
Related Questions
Q36: What is the midpoint of the class
Q37: Given the following two sets of data,
Q38: Thirty students recorded the colors of their
Q39: If a data set showing types
Q40: Graphs that show distributions using proportions instead
Q42: The three most commonly used graphs in
Q43: Which of the following is a Pareto
Q44: The following table presents the rate
Q45: One hundred students are shown an eight-digit
Q46: What are the boundaries of the class