Short Answer
The following dot plot represents the ages of the customers who visited a sporting goods store on a particular Monday. 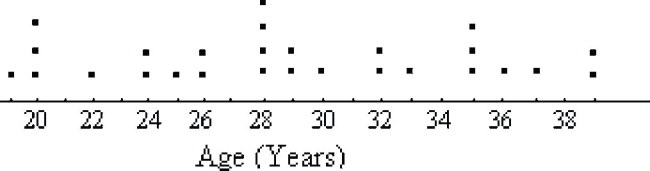
How many people in the sample were aged between 20 and 28, inclusive?
Correct Answer:

Verified
Correct Answer:
Verified
Q1: The bar chart shows the relative frequencies
Q2: The data below represent the results
Q3: Find the original data from the
Q4: using the graphical display below.<br> <img
Q6: 2|9<br>3| 12<br>3| 67788<br>4| 0233<br>4| 5567<br>5| 124<br>5|<br>6| 0
Q7: Using the graphical display below.<br><br><img src="https://d2lvgg3v3hfg70.cloudfront.net/TB2967/.jpg" alt="Using
Q8: A nurse measured the blood pressure of
Q9: <img src="https://d2lvgg3v3hfg70.cloudfront.net/TB2967/.jpg" alt=" - construct a
Q10: The Kappa Iota Sigma Fraternity polled its
Q11: Wagenlucht Ice Cream Company is always trying