Multiple Choice
The data below represent the results of a poll in which the following question was asked: "To what degree are you satisfied with your current health insurance?" Which pie chart below
Represents the given data set?
A) 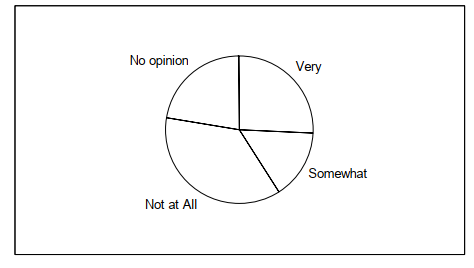
B) 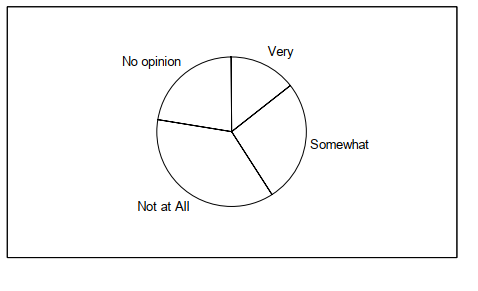
Correct Answer:

Verified
Correct Answer:
Verified
Q1: The bar chart shows the relative frequencies
Q3: Find the original data from the
Q4: using the graphical display below.<br> <img
Q5: The following dot plot represents the ages
Q6: 2|9<br>3| 12<br>3| 67788<br>4| 0233<br>4| 5567<br>5| 124<br>5|<br>6| 0
Q7: Using the graphical display below.<br><br><img src="https://d2lvgg3v3hfg70.cloudfront.net/TB2967/.jpg" alt="Using
Q8: A nurse measured the blood pressure of
Q9: <img src="https://d2lvgg3v3hfg70.cloudfront.net/TB2967/.jpg" alt=" - construct a
Q10: The Kappa Iota Sigma Fraternity polled its
Q11: Wagenlucht Ice Cream Company is always trying