Multiple Choice
The data below are the numbers of hours of homework done as reported by 24 high school juniors for the last week in September, 2006.
6, 5, 6, 4, 6, 6, 9, 7, 6, 3, 8, 5, 5, 8, 6, 5, 8, 6, 5, 7, 5, 8, 7, 4
Using bins of 2 hours width, which relative frequency histogram represents the data?
A) 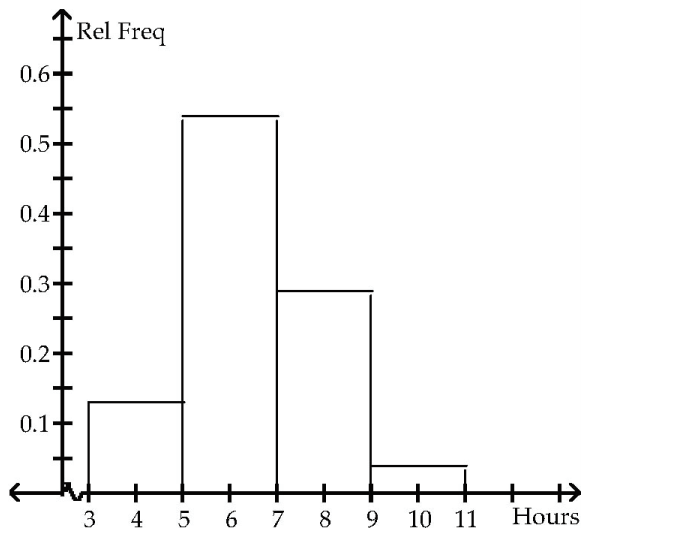
B) 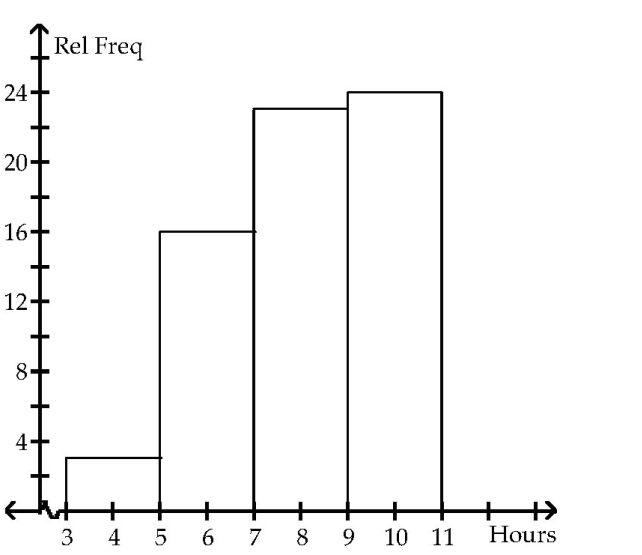
C) 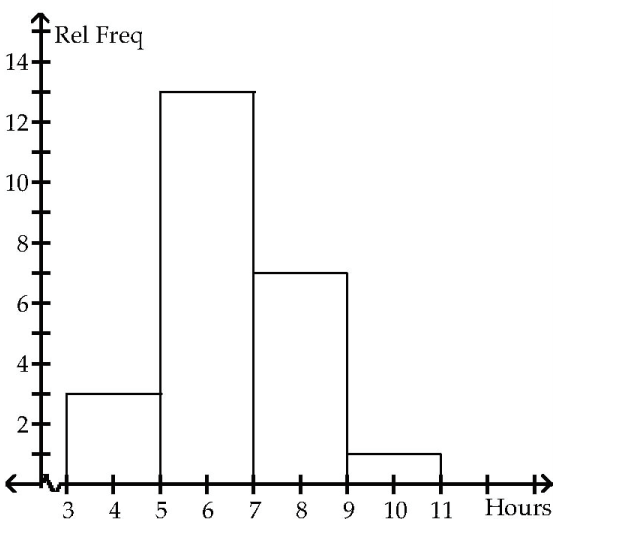
D) None of the above
Correct Answer:

Verified
Correct Answer:
Verified
Q35: Which line chart below represents the
Q36: A medical research team studied the
Q37: Using the graphical display below.<br><img src="https://d2lvgg3v3hfg70.cloudfront.net/TB2967/.jpg" alt="Using
Q38: Construct a bar chart for the
Q39: The following dot plot represents the ages
Q41: Construct a frequency table for the numbers
Q42: The data below is the number of
Q43: Using the graphical display below.<br> <img src="https://d2lvgg3v3hfg70.cloudfront.net/TB2967/.jpg"
Q44: A car dealer is deciding what
Q45: Alan tossed a die 50 times and