Multiple Choice
Using the graphical display below.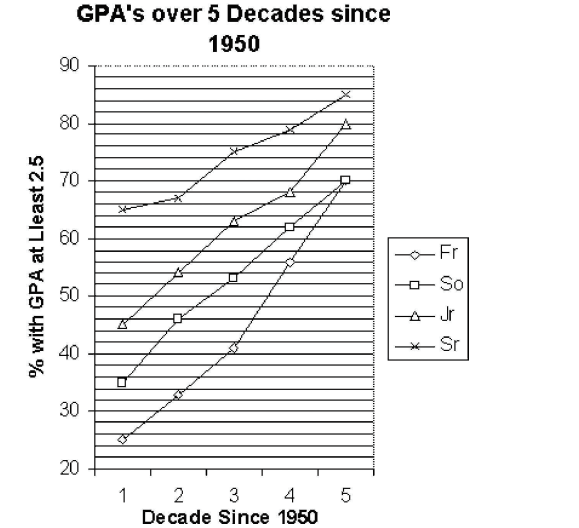
-Identify the class that had the lowest percentage increase in 2.5 or better GPA's between the fourth and fifth decades.
A) Sr
B) Jr
C) So
D) Fr
Correct Answer:

Verified
Correct Answer:
Verified
Related Questions
Q32: After reviewing a movie, 400 people
Q33: The table lists the winners of
Q34: Which line chart below represents the
Q35: Which line chart below represents the
Q36: A medical research team studied the
Q38: Construct a bar chart for the
Q39: The following dot plot represents the ages
Q40: The data below are the numbers of
Q41: Construct a frequency table for the numbers
Q42: The data below is the number of