Essay
A normal quartile plot is given below for a sample of scores on an aptitude test. Use the plot to assess the normality of scores on this test. Explain your reasoning. 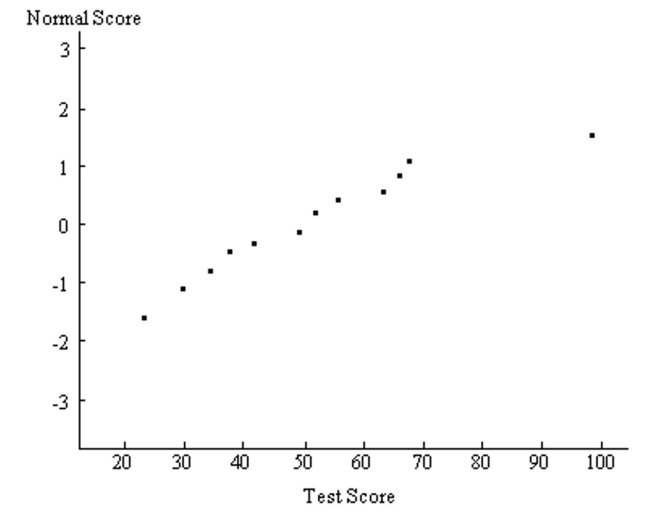
Correct Answer:

Verified
Since the normal quartile plot...View Answer
Unlock this answer now
Get Access to more Verified Answers free of charge
Correct Answer:
Verified
View Answer
Unlock this answer now
Get Access to more Verified Answers free of charge
Q40: The weights of certain machine components are
Q41: Estimate the indicated probability by using the
Q43: The Precision Scientific Instrument Company manufactures thermometers
Q44: Find the area of the shaded region.
Q46: A study of the amount of time
Q47: In a continuous uniform distribution,<br> <span
Q48: Using the following uniform density curve, answer
Q49: A recent survey based on a random
Q50: Replacement times for T.V. sets are normally
Q137: Solve the problem.<br>-After constructing a new manufacturing