Essay
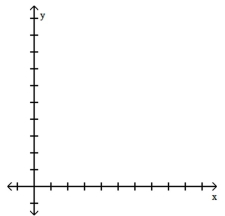
Construct a normal quartile plot of the given data. Use your plot to determine whether the data come from a normally distributed population.
-The systolic blood pressure (in mmHg) is given below for a sample of 12 men aged between 60 and 65.

Correct Answer:

Verified

Because the points lie rough...View Answer
Unlock this answer now
Get Access to more Verified Answers free of charge
Correct Answer:
Verified
Because the points lie rough...
View Answer
Unlock this answer now
Get Access to more Verified Answers free of charge
Q6: Find the indicated value.<br>- <span class="ql-formula"
Q7: Assume that X has a normal
Q8: Assume that women's heights are normally distributed
Q9: Assume that z scores are normally distributed
Q10: A bank's loan officer rates applicants for
Q12: Samples of size n = 900 are
Q13: How does the standard normal distribution differ
Q14: Estimate the indicated probability by using the
Q15: Assume that adults have IQ scores that
Q16: Find the area of the shaded region.