Multiple Choice
Find the area of the shaded region. The graph depicts the standard normal distribution with mean 0 and standard deviation 1.
-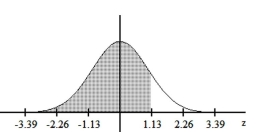
A) 0.8485
B) 0.8708
C) 0.1292
D) 0.8907
Correct Answer:

Verified
Correct Answer:
Verified
Related Questions
Q11: Construct a normal quartile plot of
Q12: Samples of size n = 900 are
Q13: How does the standard normal distribution differ
Q14: Estimate the indicated probability by using the
Q15: Assume that adults have IQ scores that
Q17: Find the indicated IQ score. The graph
Q18: Find the indicated z score. The graph
Q19: Estimate the indicated probability by using the
Q20: In a population of 210 women,
Q21: A population consists of these values: