Multiple Choice
Find the area of the shaded region. The graph depicts IQ scores of adults, and those scores are normally distributed with a mean of 100 and a standard deviation of 15 (as on the Wechsler test) . 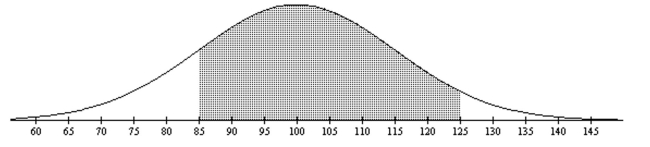
A) 0.7303
B) 0.7619
C) 0.7938
D) 0.7745
Correct Answer:

Verified
Correct Answer:
Verified
Related Questions
Q95: Use the normal distribution to approximate the
Q96: A study of the amount of time
Q97: If z is a standard normal variable,
Q98: Find the area of the shaded region.
Q99: Provide an appropriate response.
Q101: The annual precipitation amounts in a certain
Q102: Complete the following table for a
Q103: The Precision Scientific Instrument Company manufactures
Q104: Computers are often used to randomly generate
Q105: Assume that <span class="ql-formula" data-value="z"><span