Multiple Choice
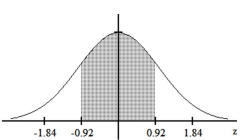
Find the area of the shaded region. The graph depicts the standard normal distribution with mean 0 and standard deviation 1.
-
A) 0.3576
B) 0.6424
C) 0.8212
D) 0.1788
Correct Answer:

Verified
Correct Answer:
Verified
Related Questions
Q93: In a population of 225 women,
Q94: Three randomly selected households are surveyed
Q95: Use the normal distribution to approximate the
Q96: A study of the amount of time
Q97: If z is a standard normal variable,
Q99: Provide an appropriate response.
Q100: Find the area of the shaded region.
Q101: The annual precipitation amounts in a certain
Q102: Complete the following table for a
Q103: The Precision Scientific Instrument Company manufactures