Multiple Choice
Find the indicated z score. The graph depicts the standard normal distribution with mean 0 and standard deviation 1.
-Shaded area is 0.0401. 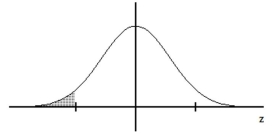
A)
B)
C)
D)
Correct Answer:

Verified
Correct Answer:
Verified
Related Questions
Q1: The distribution of certain test scores
Q2: A poll of 1500 randomly selected students
Q3: If z is a standard normal variable,
Q5: If selecting samples of size n
Q6: Find the indicated value.<br>- <span class="ql-formula"
Q7: Assume that X has a normal
Q8: Assume that women's heights are normally distributed
Q9: Assume that z scores are normally distributed
Q10: A bank's loan officer rates applicants for
Q11: Construct a normal quartile plot of